Definition of terms
Types of Protest: This refers to the different forms and manners of protest.
- Blockade – Protestors physically prevented movement of people or vehicles to or from a location
- Hunger Strike – Prolonged refusal to eat carried out as a protest
- Dialogue – Days of dialogue/moratoria held to discuss an issue surrounding a protest

- March – Protestors walk in a mass group formation.
- Rally – Protestors gather to hear speakers and speak out against injustice/ for a cause
- Petition – Protestors show support for demands/ against injustice by signing a document
- Sit in – Protestors occupy a place as a form of protest
- Vigil – Assembly of people to protest suffering of individuals who are victims of injustice
- Strike – Boycott of classes and academic activities in protest
- Walk Out – Leaving a talk/meeting/event in the middle to show disagreement
- Miscellaneous – Unique forms of protest eg interrupting classes, throwing parties etc.
Issues being protested: This refers to the different concerns that formed the context of the protests
- Administration – Administrative decisions being contested in protests
- Comical – Playful concerns which resulted in humorous protests
- Corporations – Regarding companies and organizations
- Environment & Climate Change –
- Race Relations – Regarding concerns and injustices against people of color
- Sexual Assault – Regarding sexual violence or abuse
- Sexuality and Gender –Regarding discrimination on the basis sexual orientation, queer identity and gender based discrimination
- Student Life – Regarding issues affecting students on a day to day
- War and Politics – Regarding the state of nation and world affairs, mostly in politics and war
- Health – Regarding issues about physical and mental health.
The Map
![]()
There is a view toolbar on the top left of the map which has different features that help with the zooming and panning options of the map. The pin resets the map to the overall view. Upon hovering over the triangle, a set of different tools appear which enable one to make a selection, zoom and pan over a specific area on the map ![]() .
.
The Map gives an overall broad view of all the protests in both eras. Each circle within the map represent a protest, and they are scaled by different sizes according to number of Amherst College students who participated in the protest (as opposed to overall protest size which would yield drastic sizes, make it visually difficult to navigate). When hovering over the circles details of the protest appear such as the Headline, the issue students were protesting about,the manner of protest that was used,the overall protest size &a breakdown of participants in terms of Amherst students, faculty, as well as 5 college students (if available).
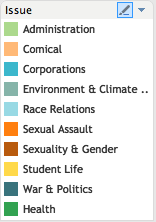 The circles are color coded according to the by issue being protested, and can be filtered according to issue by selecting the highlight tool on the top right of map legend and then selecting the issue of interest.
DISCLAIMER: Not all protests are included in the map. Those that occurred in the form of petitions or on online platforms were not mapped due to lack of coordinates. Refer to the Timeline for a more holisitic overview of the protests.
Comparison by Issue
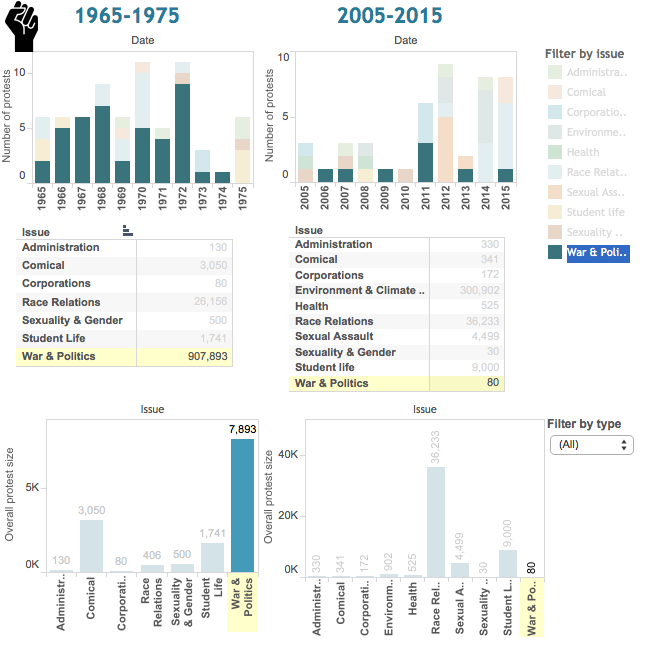 This visualization allows a comparison to be made of the different issues that students were protesting about. The different graphs indicate how many protests happened about a certain issue and plots overall protest size for each issue. Selecting an issue on the legend highlights the data about that issue across all the different graphs and tables.
There also exists an option to filter by type, which allows for one to observe a correlation between the issue(i.e race relations, war) being protested and the type (i.e march, petition) of protest. It also enables one to compare protest sizes of different types of protest. As in the map, hovering over the graphs reveal more specific details about the protests.
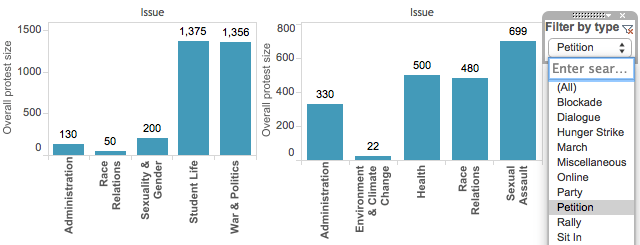
Comparison by type
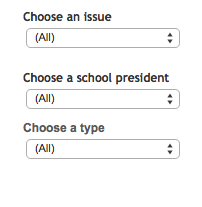 This visualization allows a comparison to be made of the different types of protests that defined the nature of protests of their respective eras. The graphs plot type of protest against number of protests, and also include overall protest sizes in the labels. The three filters can be used individually or simultaneously to narrow down the results of the graphs. The use of these are quite intuitive and easy to follow.
If at any point while interacting with the visualization data gets mixed up or alterations are made, click on the reset button on the bottom right of visualization image to restore it to its original view.
DISCLAIMER: Some of the data entries are missing numbers of the protest size and composition as they were lacking in the data source. Thus the numbers indicated are aggregated from the data that was available.
Project Summary | Timeline: 1965-1975 | Timeline: 2005-2015 | Navigation guide | Visualization
Project by Norah Oteri ’18