Brain-storming
As with all great geniuses, the concept for this project came to me in the middle of the night, after being hit with a beam from a celestial God, who displayed himself unto me in the holy form of a Merguana, a creature that is half iguana and half lizard.
I jest, of course. He was actually half gecko and ashamed of his low caste lineage.
In reality, the idea for the project was developed surprisingly quickly. It was the first idea I pitched during the brainstorming for our TimeMapper deliverables… which I think I may have been the first assignment we had as well. I didn’t plan on doing it for my final project at the time, but it grew on me. 
The process for this original deliverable was almost identical to that of my final project. We selected 20 or so articles, read them and filled out metadata for the following categories:
- Title
- Date
- Summary
- Location (informal or formal)
- Long/Lat
- URL (if applicable.
And ultimately, we ended up with this tiny TimeMap. Quaint, in a way.
Brain-typhooning
Of course, that original TimeMap is missing one major component from the final project- the tags describing categories. I’d wanted to ascribe more tangible data to the TimeMap, which would allow trends to be tracked in an easier fashion. For that reason, I devised the 5 tags, which would help track trends in each publication. It was a mostly straight-forward process.
Data Collection
Straight-forward, however, does not mean easy. At first, I was incredibly optimistic that I could catalog every comedy piece ever written. The idiocy of that belief became apparent after my first issue of the Hamster, which took an hour to catalog. Writing summaries as well as searching articles for tangible locations extended the process a great deal because of the level of interaction required. I quickly cut down to articles from exclusively comedy-focused publications. This meant that pubs like the Indicator or literary magazines wouldn’t force me to dredge through amateur short stories that are so bad they seem like comedy pieces. Unfortunately, this also meant saying goodbye to the April Fools issue of the student, which is the closest thing to a long-running publication that Amherst has. I also decided that if a piece did not have a title, then it wasn’t eligible. Short jokes would’ve clogged up the pipes of progress.
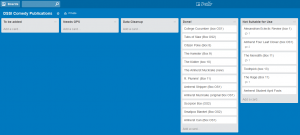
Afterwards, all I had to do was read 500+ comedy pieces and restrain from crushing myself in the moving bookshelves on C-level. It was a week’s worth of fast, grueling work. To speed up the process, I decided to look up the lat/long for coordinates afterwards, and instead take notes on the locations. One saving grace throughout this process was Trello, a management tool that lets you create cards with movable entries. I used it to categorize different publications as I went through, allowing me to change what exactly I was focusing on to break the monotony.
Data Refinement
One of the greatest assets in TimeMapper is the template spreadsheet that it provides. If you type in “Amherst, MA” into the location box, it will automatically provide you with the latitude and longitude of the location. It can even work for less specific locations like “Africa” as well as landmarks like “Statue of Liberty.” It saved me at least a day’s worth of work because it was even able to register some buildings on campus.
TimeMapper, however, is not smart enough to understand the obvious notes like “O.J. Simpson’s house”, “Sharper Image’s Former headquarters” or “That one lumpy hill by the socials that everyone drunkenly trips over.” For these kinds of locations, I used the site Gps-Coordinates.net which allows you to look up addresses and get their. This took about 2 days of work to generate all of the longitude and latitudes. I also had to split those latitudes and longitudes up for processing in Tableau, which required a clever application of the find and replace tools, as well as Excel’s plain text convert function.
Final Production
TimeMapper is excellent for out of the box production, all I had to do was insert the link to my Google spreadsheet and I was ready to go.
Unfortunately, I don’t have any documentation from my work with Tableau– I was in the middle of a worksheet when my laptop began to smoke. I’m assured it’s because I was making so much headway on the project. I can say that working with Tableau is an absolute breeze when it comes to simple graphs- the only place where Excel surpasses Tableau is in violating the Geneva human rights accords.
After that, it was simply a matter of laying out the WordPress and correcting typos, bad links, etc. It’s always easier to just move something than get rid of it, so I’ve jst mput aIL those typos 1n this oen sentecen?
Reflections
While I’m proud of my final project, I do wish I could spend a little more time to get more data and more articles. Much as I complain about the work, I think the project would benefit greatly from the inclusion of the Student’s April Fools issue, which would offer 20-30 articles from each year since the 80s. That would be a lot of data!I also would love to examine those issues of the Student, which have been OCR’d, through text analysis and topic modelling.